In an era where AI can generate hundreds of lines of code in seconds, the old metric of "Lines of Code" (LOC) has become effectively useless for measuring progress. However, one classic metric remains as vital as ever: Cyclomatic Complexity.
Developed by Thomas J. McCabe in 1976, Cyclomatic Complexity is a quantitative measure of the number of linearly independent paths through a program's source code. In simpler terms: it's a count of how many decisions your code makes.
The Science of Paths: McCabe's Formula
The complexity standard is often calculated using the formula V(G) = E - N + 2P, where:
- E: The number of edges in the control flow graph.
- N: The number of nodes in the control flow graph.
- P: The number of connected components (usually 1 for a single function).
While the math might seem daunting, the implication is simple: every if, for,
while, case, and catch block increases the complexity by exactly
one.
The higher the number, the more tests you need to reach 100% path coverage.
The Cognitive Ceiling: Seven Plus or Minus Two
Why do we care about a number? Because human working memory has a finite limit. Psychologists often cite "The Magical Number Seven, Plus or Minus Two" as the limit for how many objects an average human can hold in short-term memory.
When a function's complexity exceeds 10, it typically means a developer must keep more than seven logical branches in their head simultaneously to understand the full flow. This is where "bugs" are born—not from incorrect syntax, but from the simple failure of human memory during a logical intersection.
# Low Complexity (1) - Easy to verify
def greet(name):
    return f"Hello, {name}"

# Higher Complexity (4) - Requires focused attention
def handle_user(user):
    if not user:
        return "No user"
    if user.is_admin:
        return "Welcome Admin"
    if user.is_banned:
        return "Access Denied"
return "Standard User"Actionable Wins: Reducing the Friction
If your AST Analyser flags a high-complexity function, you don't always need a full rewrite. Often, simple refactoring patterns can bring the score down significantly:
- Guard Clauses: Use early returns to handle edge cases first, reducing the "indentation debt" of the primary logic.
- Function Extraction: If a branch contains significant logic, move it to its own named function. This resets the complexity "counter" for the parent function.
- Table-Driven Logic: Replace large
switchorif-elsechains with a dictionary or map lookup.
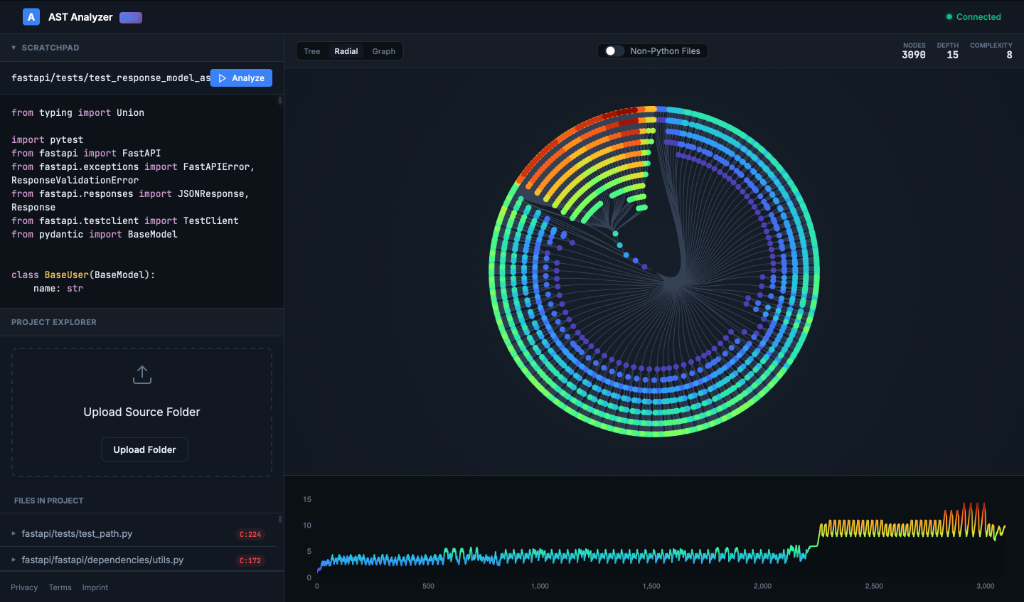
Visualizing the Heat Map
At AST Visualizer, we treat complexity as a "heat map" for your codebase. Our algorithms analyze every function across your project, assigning a visual weight based on its branch logic.
By identifying functions with a score over 10 (the industry standard for "risky"), we help your team prioritize refactoring efforts where they will have the most impact on long-term stability and developer velocity.
Analyze Your Project's Complexity →